Chat with Fundamentals v2.0.0 Technical Documentation
Complete reference for financial research and portfolio management platform
What is Chat with Fundamentals?
Chat with Fundamentals is a full-stack financial research and portfolio management platform designed to automate and enhance financial analysis through AI-powered tools. The platform features:
- Multi-Agent AI Analysis: Autonomous agents for analyzing stocks, ETFs, forex, and macro indicators
- Portfolio Management: Shares-based tracking with 5 optimization strategies (Actual, Equal Weight, MVO, Min Variance, Black-Litterman)
- RAG Systems: Retrieval-Augmented Generation for quant research papers and SEC filings
- Comprehensive Data Integration: 50+ EODHD API endpoints across 9 categories
- Advanced Analytics: Monte Carlo simulations, VaR, CVaR, rolling Sharpe ratios
- Database Management: PostgreSQL + TimescaleDB + Redis + ChromaDB architecture
- Real-Time Monitoring: WebSocket-based agent console for live debugging
Key Features
Portfolio Management
- Shares-based position tracking
- 5 optimization strategies
- Multi-asset support (stocks, ETFs, forex)
- Performance attribution
AI Analysis
- 4 specialized agents (fundamentals, news, price, macro)
- BUY/HOLD/SELL recommendations
- Real-time WebSocket logging
- Agent console for debugging
RAG Systems
- Quant research paper library
- SEC filings analysis (10-K, 10-Q, 8-K)
- ChromaDB vector storage
- OpenAI embeddings
Database Management
- Fundamentals data management
- Price history storage (TimescaleDB)
- News aggregation
- Multiple asset types
Risk Analytics
- Monte Carlo simulations
- VaR & CVaR calculations
- Rolling Sharpe ratios
- Correlation analysis
EODHD Integration
- 50+ API endpoints
- 9 data categories
- Real-time & historical data
- Fundamentals & financials
System Architecture
High-Level Overview
Chat with Fundamentals uses a modern full-stack architecture with clear separation between frontend, backend, and data layers:
Architecture Components
Frontend Layer (Next.js 13+)
- React 18: Component-based UI with hooks and context
- TypeScript: Type-safe development
- TailwindCSS: Utility-first styling
- shadcn/ui: Accessible component library
- Recharts: Financial charts and visualizations
- WebSocket Client: Real-time agent console updates
Backend Layer (FastAPI)
- FastAPI Framework: High-performance async Python API
- Pydantic Models: Data validation and serialization
- SQLAlchemy ORM: Database abstraction layer
- WebSocket Server: Real-time agent logging
- CrewAI Integration: Multi-agent orchestration
- LangChain: RAG pipeline and embeddings
Data Layer
- PostgreSQL: Primary relational database for fundamentals, portfolios, users
- TimescaleDB Extension: Time-series optimization for price data
- Redis: Caching layer for API responses and session management
- ChromaDB: Vector database for RAG embeddings
External Services
- EODHD API: Market data provider (50+ endpoints)
- OpenAI API: GPT models for MarketSense AI and RAG
- SEC EDGAR: Public filings data source
Installation & Setup
Prerequisites
- Python 3.10+
- Node.js 18+
- PostgreSQL 14+
- Redis 7+
- Docker & Docker Compose (optional)
Backend Setup
1. Clone Repository & Install Dependencies
# Navigate to backend directory
cd backend

# Create virtual environment
python -m venv venv
source venv/bin/activate  # On Windows: venv\Scripts\activate

# Install dependencies
pip install -r requirements.txt
2. Configure Environment Variables
Create .env file in backend directory:
# Database
DATABASE_URL=postgresql://user:password@localhost:5432/chat_with_fundamentals
REDIS_URL=redis://localhost:6379

# API Keys
EODHD_API_KEY=your_eodhd_api_key
OPENAI_API_KEY=your_openai_api_key

# ChromaDB
CHROMA_PERSIST_DIR=./chroma_db

# Server
API_HOST=0.0.0.0
API_PORT=8000
3. Initialize Database
# Run migrations
alembic upgrade head

# Create TimescaleDB hypertables
python -m app.db.init_timescale
4. Start Backend Server
# Development mode with auto-reload
uvicorn app.main:app --reload --host 0.0.0.0 --port 8000

# Production mode
uvicorn app.main:app --host 0.0.0.0 --port 8000 --workers 4
Frontend Setup
1. Install Dependencies
# Navigate to frontend directory
cd frontend

# Install npm packages
npm install
2. Configure Environment Variables
Create .env.local file in frontend directory:
NEXT_PUBLIC_API_URL=http://localhost:8000
NEXT_PUBLIC_WS_URL=ws://localhost:8000
3. Start Development Server
# Development mode
npm run dev

# Build for production
npm run build

# Start production server
npm start
Docker Deployment
# Build and start all services
docker-compose up -d

# View logs
docker-compose logs -f

# Stop services
docker-compose downTechnology Stack
Frontend Technologies
| Technology | Version | Purpose |
|---|---|---|
| Next.js | 13+ | React framework with SSR and routing |
| React | 18 | UI component library |
| TypeScript | 5 | Type-safe JavaScript |
| TailwindCSS | 3 | Utility-first CSS framework |
| shadcn/ui | Latest | Accessible component library |
| Recharts | 2 | Chart library for data visualization |
Backend Technologies
| Technology | Version | Purpose |
|---|---|---|
| FastAPI | 0.104+ | High-performance async web framework |
| Python | 3.10+ | Backend programming language |
| SQLAlchemy | 2.0 | ORM for database operations |
| Pydantic | 2.0 | Data validation and serialization |
| CrewAI | Latest | Multi-agent orchestration framework |
| LangChain | Latest | RAG pipeline and embeddings |
| PyPortfolioOpt | 1.5+ | Portfolio optimization algorithms |
Database & Storage
| Technology | Version | Purpose |
|---|---|---|
| PostgreSQL | 14+ | Primary relational database |
| TimescaleDB | 2.11+ | Time-series extension for price data |
| Redis | 7+ | Caching and session management |
| ChromaDB | Latest | Vector database for RAG embeddings |
External APIs
| Service | Purpose |
|---|---|
| EODHD API | Market data, fundamentals, financials |
| OpenAI API | GPT models for AI analysis and embeddings |
| SEC EDGAR | Public company filings |
Portfolio Management
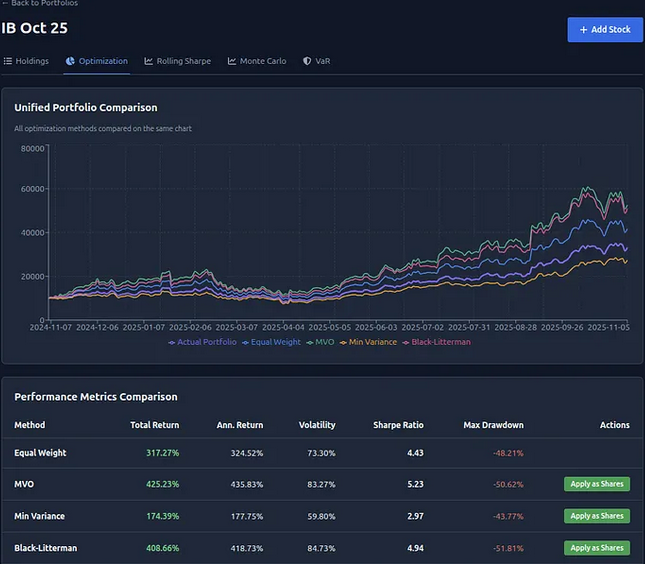
Overview
The Portfolio Management module provides comprehensive tools for tracking and optimizing investment portfolios with shares-based position tracking and advanced optimization strategies.
Core Features
- Shares-Based Tracking: Track positions by number of shares (not just dollar amounts)
- 5 Optimization Strategies: Actual, Equal Weight, MVO, Min Variance, Black-Litterman
- Multi-Asset Support: Stocks, ETFs, forex pairs
- Performance Attribution: Analyze returns by position and time period
- Real-Time Updates: Live portfolio value updates based on market prices
- Historical Tracking: Daily snapshots for performance analysis
Optimization Strategies
1. Actual Portfolio
Your current holdings as entered in the system, reflecting your real investment positions.
2. Equal Weight
Allocates portfolio value equally across all positions:
weight_i = 1 / N
where N = number of positions
3. Mean-Variance Optimization (MVO)
Maximizes Sharpe ratio using historical returns and covariance:
max w^T μ - λ/2 w^T Σ w
subject to: w^T 1 = 1, w ≥ 0
where:
  w = portfolio weights
  μ = expected returns
  Σ = covariance matrix
  λ = risk aversion parameter
4. Minimum Variance
Minimizes portfolio volatility regardless of expected returns:
min w^T Σ w
subject to: w^T 1 = 1, w ≥ 0
5. Black-Litterman
Combines market equilibrium with investor views:
E[R] = [(τΣ)^-1 + P^T Ω^-1 P]^-1 [(τΣ)^-1 Π + P^T Ω^-1 Q]
where:
  Π = market equilibrium returns
  P = view matrix
  Q = view returns
  Ω = view uncertainty
  τ = scaling factor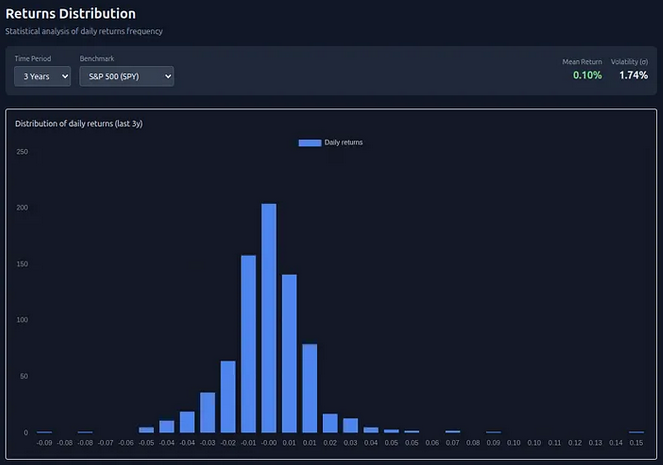
API Endpoints
Get current portfolio positions with real-time prices
Source: backend/app/api/portfolio.py:45-78
# Response
{
  "positions": [
    {
      "symbol": "AAPL",
      "shares": 100,
      "avg_cost": 150.25,
      "current_price": 175.50,
      "market_value": 17550.00,
      "unrealized_pnl": 2525.00,
      "unrealized_pnl_pct": 16.81
    }
  ],
  "total_value": 125000.00,
  "total_cost": 100000.00,
  "total_pnl": 25000.00
}Optimize portfolio using selected strategy
Source: backend/app/api/portfolio.py:125-189
# Request
{
  "strategy": "mvo",  // actual | equal_weight | mvo | min_variance | black_litterman
  "risk_free_rate": 0.045,
  "lookback_days": 252
}

# Response
{
  "strategy": "mvo",
  "weights": {
    "AAPL": 0.25,
    "MSFT": 0.30,
    "GOOGL": 0.20,
    "AMZN": 0.25
  },
  "metrics": {
    "expected_return": 0.185,
    "volatility": 0.142,
    "sharpe_ratio": 0.98
  }
}Add or update portfolio position
Source: backend/app/api/portfolio.py:80-123
# Request
{
  "symbol": "AAPL",
  "shares": 100,
  "avg_cost": 150.25,
  "transaction_date": "2025-01-15"
}

# Response
{
  "position_id": 123,
  "symbol": "AAPL",
  "shares": 100,
  "avg_cost": 150.25
}
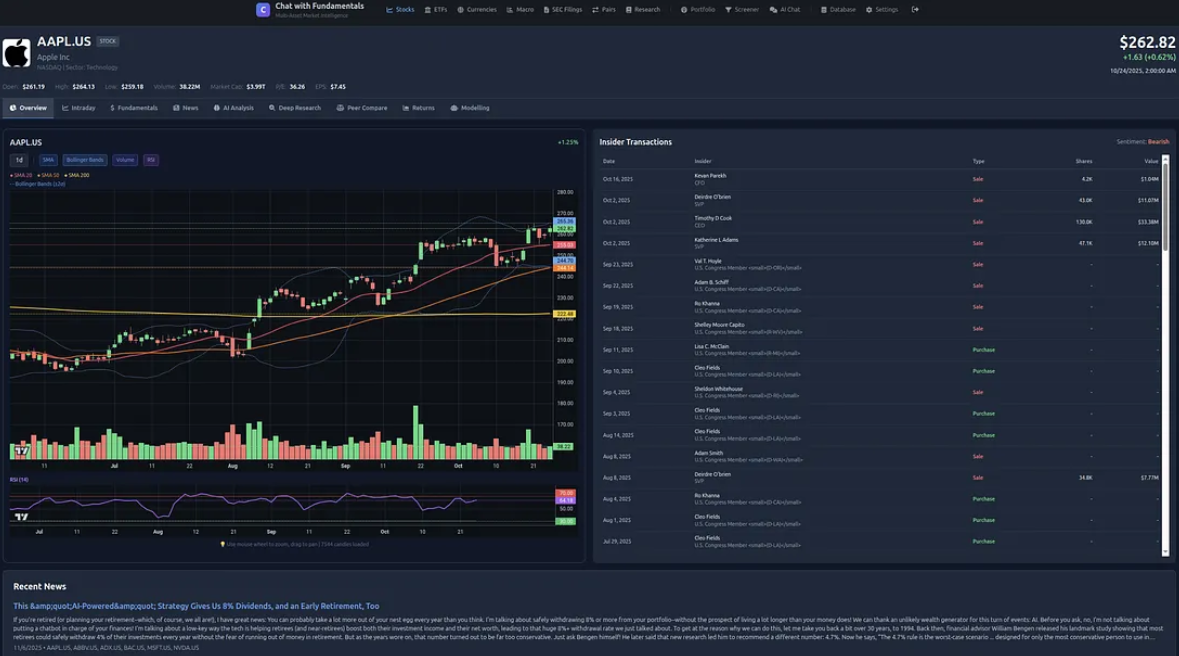
AI Analysis
Overview
The AI Analysis module is a multi-agent system built with CrewAI that provides comprehensive stock analysis through four specialized agents. Inspired by multi-agent frameworks for financial analysis.
Agent Architecture
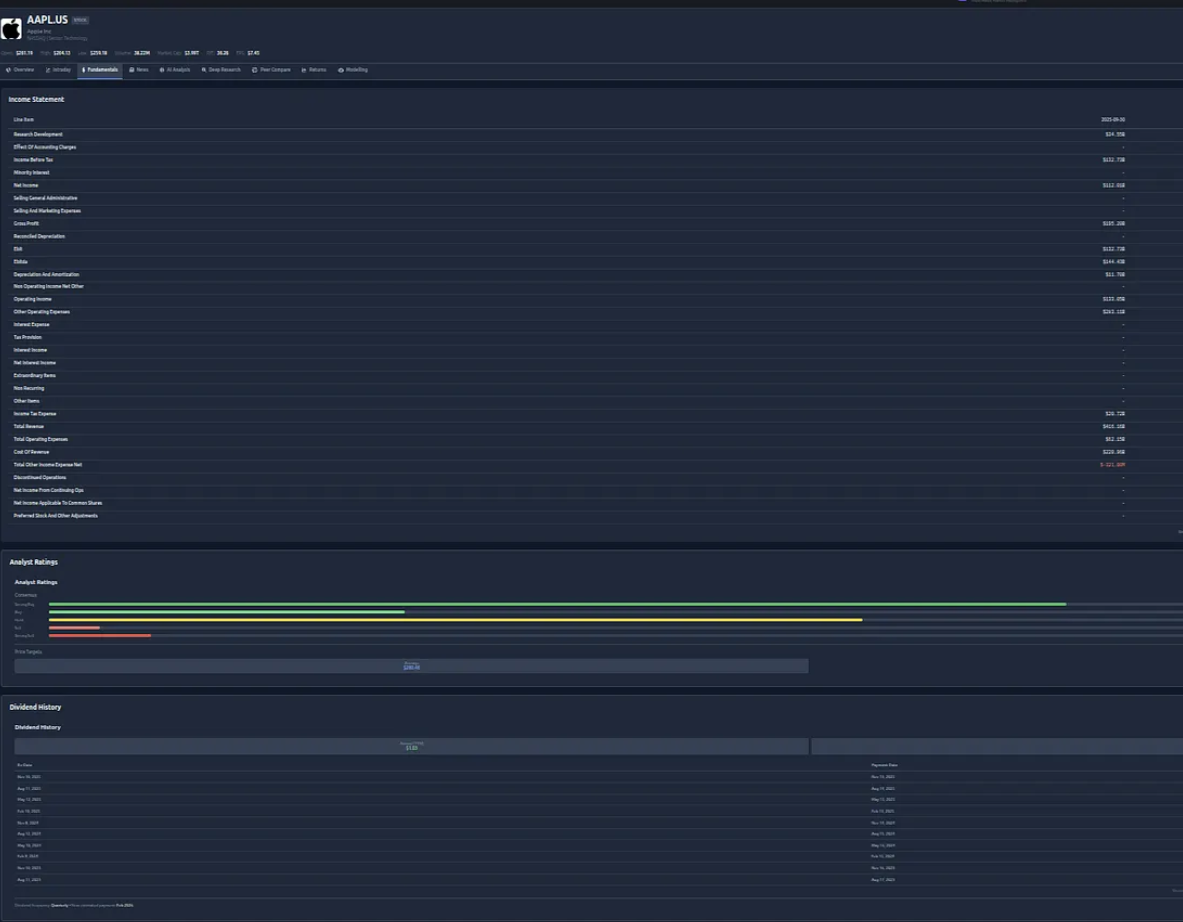
1. Fundamentals Agent
- Role: Analyzes company financials and fundamentals
- Data Sources: Income statements, balance sheets, cash flow statements
- Metrics: P/E ratio, debt-to-equity, profit margins, revenue growth
- Output: Fundamental strength score (1-10)
2. News Agent
- Role: Analyzes recent news sentiment and major events
- Data Sources: Financial news, press releases, earnings calls
- Analysis: Sentiment analysis, event impact assessment
- Output: News sentiment score (-10 to +10)
3. Price Agent
- Role: Technical analysis and price pattern recognition
- Data Sources: Historical prices, volume, technical indicators
- Analysis: Trend identification, support/resistance, momentum
- Output: Technical score (1-10)
4. Macro Agent
- Role: Analyzes macroeconomic environment and sector trends
- Data Sources: Economic indicators, sector performance, market conditions
- Analysis: Interest rates, GDP growth, sector rotation
- Output: Macro environment score (1-10)
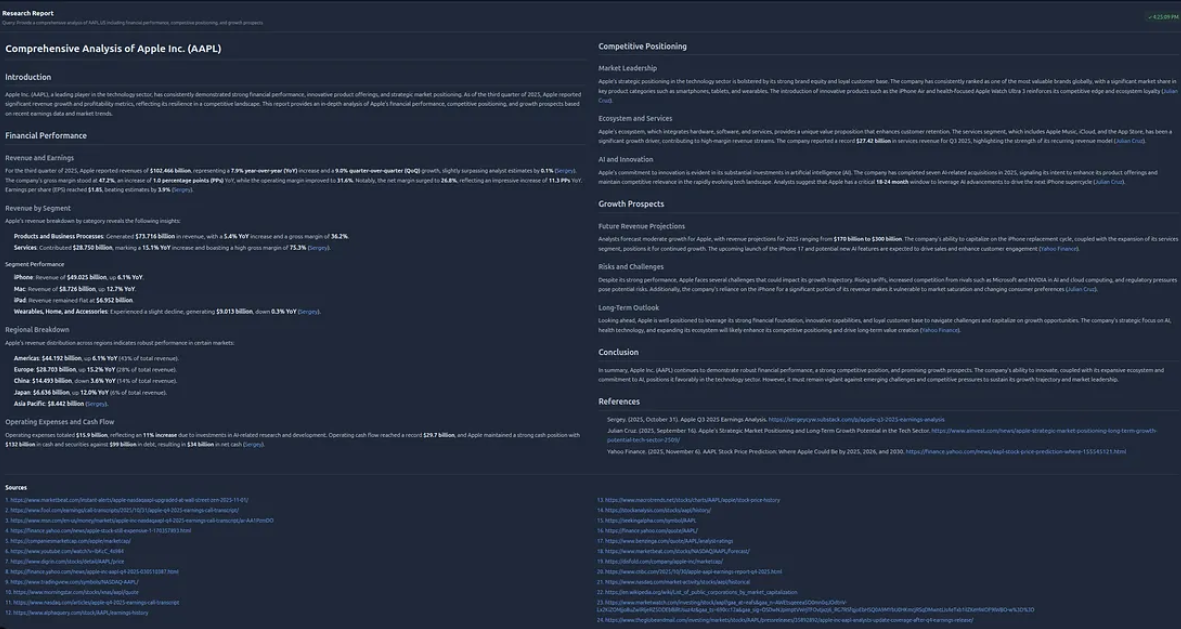
Final Recommendation
A Portfolio Manager agent synthesizes all agent outputs to generate:
- Signal: BUY / HOLD / SELL
- Conviction: 1-10 score indicating confidence level
- Reasoning: Detailed explanation of recommendation
- Risk Factors: Key risks to monitor
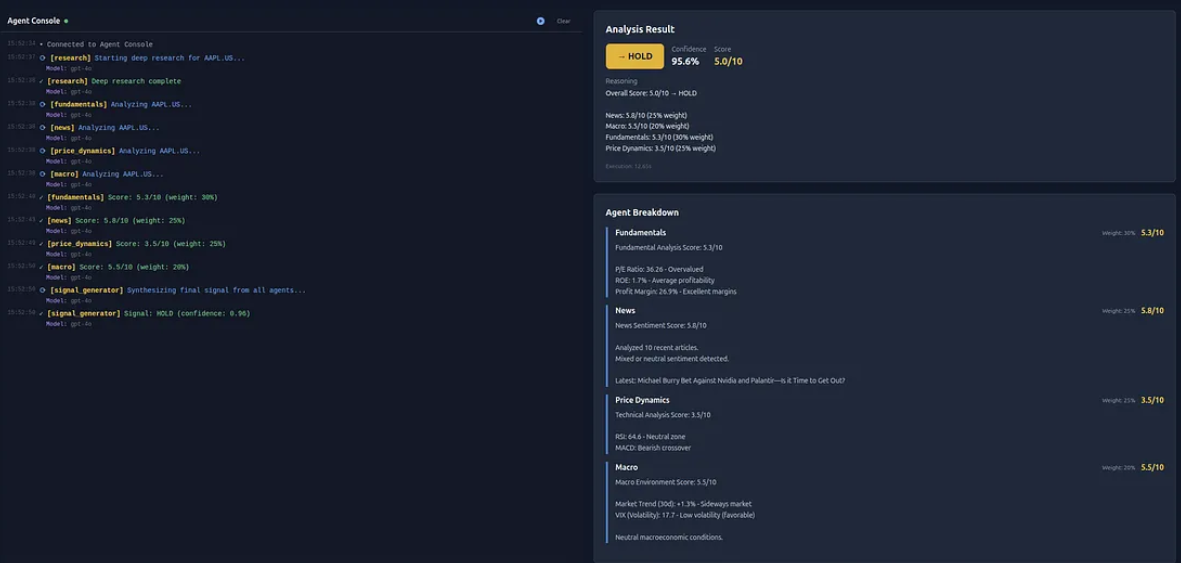
Agent Console
Real-time WebSocket-based debugging console showing agent thought processes:
- Live agent status updates
- Task execution logs
- Tool usage tracking
- Error messages and warnings
API Endpoints
Run AI analysis on a symbol
Source: backend/app/api/marketsense.py:34-112
# Request
{
  "symbol": "AAPL",
  "analysis_type": "stock",  // stock | etf | forex | macro
  "llm_provider": "openai"   // openai | anthropic
}

# Response
{
  "symbol": "AAPL",
  "timestamp": "2025-01-15T10:30:00Z",
  "signal": "BUY",
  "conviction": 8,
  "agent_scores": {
    "fundamentals": 9,
    "news": 7,
    "price": 8,
    "macro": 7
  },
  "reasoning": "Strong fundamentals with positive earnings surprise...",
  "risk_factors": ["Regulatory concerns", "Valuation metrics"],
  "execution_time_seconds": 45.2
}WebSocket endpoint for real-time agent console
Source: backend/app/api/websocket.py:23-67
# WebSocket Messages
{
  "event": "agent_status",
  "agent": "fundamentals",
  "status": "running",
  "message": "Analyzing financial statements..."
}

{
  "event": "task_complete",
  "agent": "news",
  "output": "Positive sentiment from recent earnings call"
}

{
  "event": "final_recommendation",
  "signal": "BUY",
  "conviction": 8
}
RAG Systems
Overview
Chat with Fundamentals includes two Retrieval-Augmented Generation (RAG) systems for querying quantitative research papers and SEC filings using natural language.
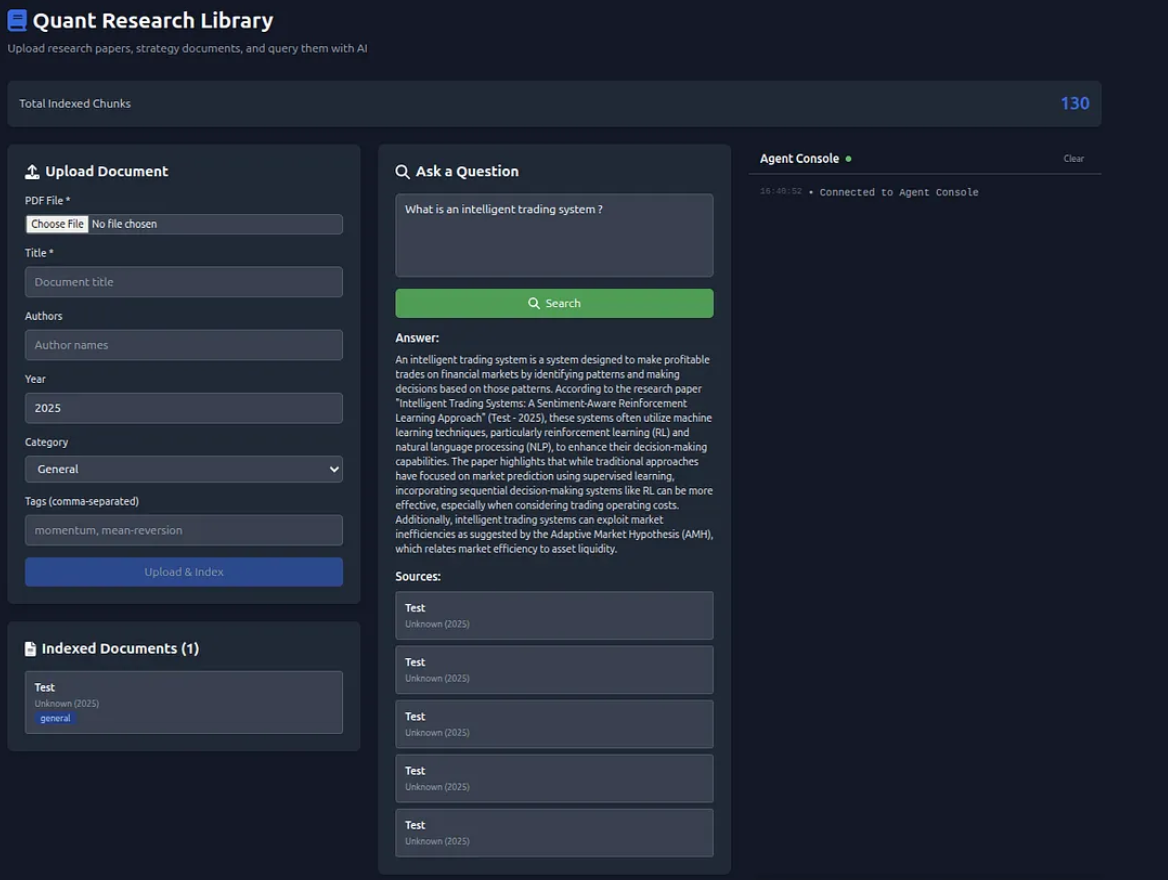
1. Quant Research Library RAG
Semantic search over a curated library of quantitative finance research papers.
Features
- Paper Collection: 500+ academic papers on quant strategies, risk management, portfolio optimization
- Semantic Search: Find relevant papers using natural language queries
- Citation Tracking: Automatically includes paper titles, authors, years
- Context Retrieval: Returns relevant sections with page numbers
Implementation
- Vector Store: ChromaDB
- Embeddings: OpenAI text-embedding-3-small
- Chunking: ~1000 tokens with 200-token overlap
- Retrieval: Top-k similarity search (k=5)
2. SEC Filings RAG
Query company SEC filings (10-K, 10-Q, 8-K) using natural language.
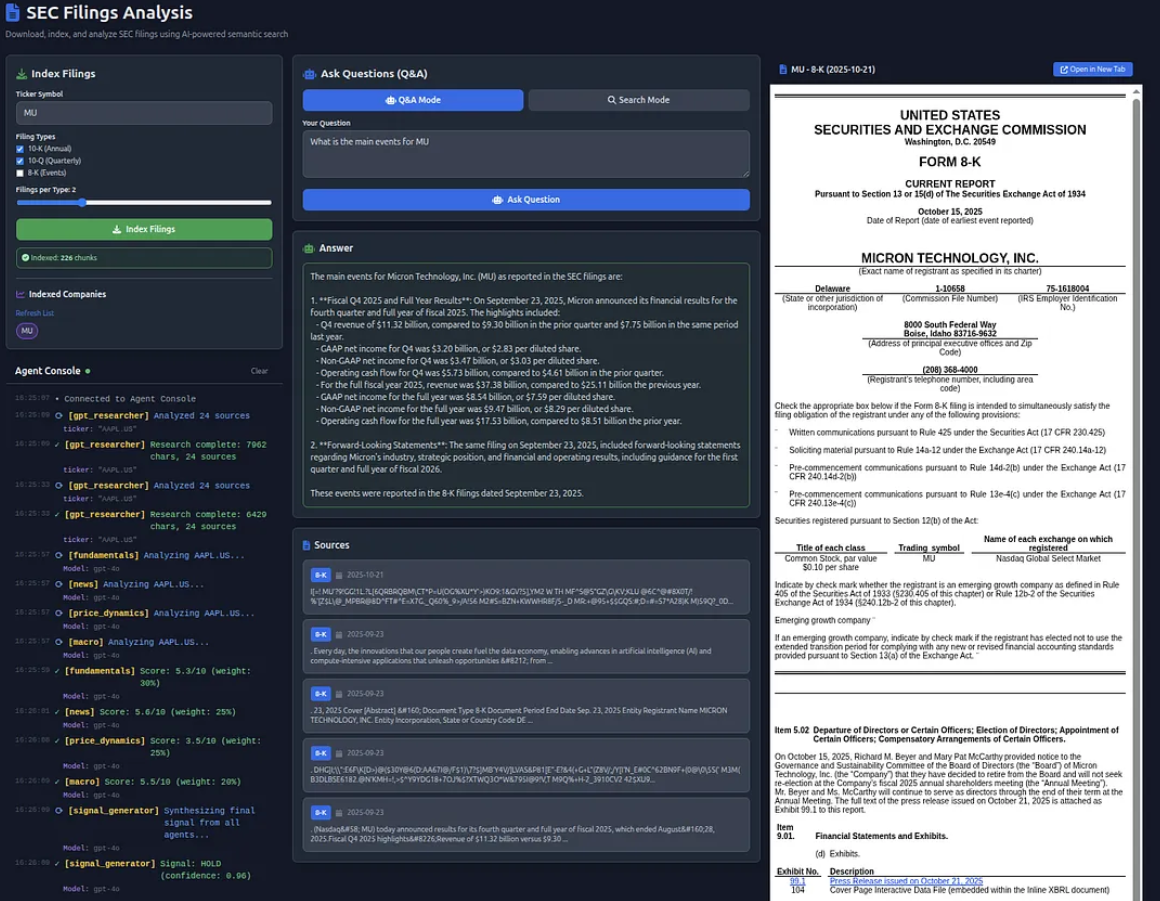
Features
- Filing Types: 10-K (annual), 10-Q (quarterly), 8-K (current events)
- Company Coverage: All public US companies
- Historical Data: Filings from 2020-present
- Section Extraction: Automatically parses standard SEC sections
Common Queries
- "What are the key risk factors for AAPL?"
- "Summarize MSFT's revenue breakdown by segment"
- "What did TSLA say about production capacity in their latest 10-Q?"
- "Compare GOOGL's R&D spending over the last 3 years"
RAG Pipeline
1. User Query → Embedding
2. Vector Search → Retrieve Top-k Chunks
3. Context + Query → LLM (GPT-4)
4. LLM Response → Citation Formatting
5. Return Answer with SourcesAPI Endpoints
Query quantitative research paper library
Source: backend/app/api/rag.py:45-98
# Request
{
  "query": "What are the best momentum strategies for equity markets?",
  "top_k": 5
}

# Response
{
  "answer": "Based on the research papers, the most effective momentum strategies...",
  "sources": [
    {
      "title": "Momentum Strategies in Equity Markets",
      "authors": ["Smith, J.", "Doe, A."],
      "year": 2022,
      "page": 15,
      "excerpt": "...relevant text..."
    }
  ],
  "execution_time_seconds": 2.3
}Query SEC filings for specific companies
Source: backend/app/api/rag.py:100-156
# Request
{
  "symbol": "AAPL",
  "query": "What are the main risk factors?",
  "filing_types": ["10-K", "10-Q"],
  "years": [2023, 2024]
}

# Response
{
  "answer": "Apple's main risk factors include...",
  "sources": [
    {
      "symbol": "AAPL",
      "filing_type": "10-K",
      "filing_date": "2024-11-03",
      "section": "Risk Factors",
      "page": 8,
      "excerpt": "...relevant text..."
    }
  ]
}
Database Management
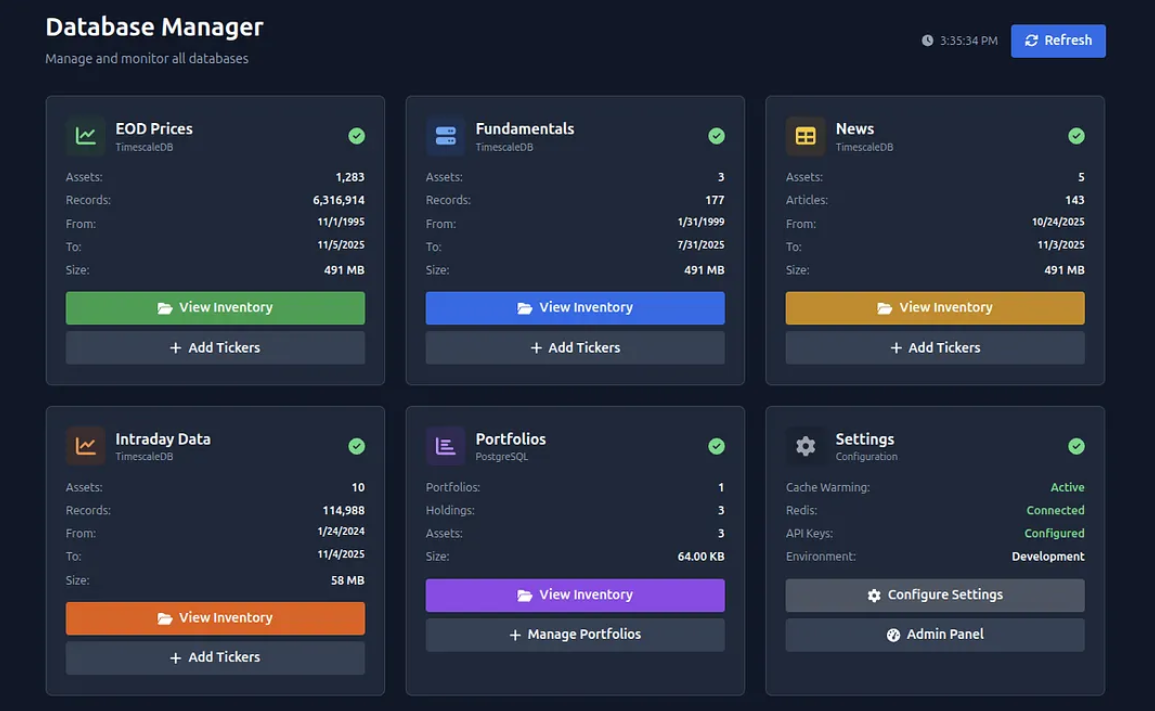
Overview
The Database Management module provides comprehensive tools for managing fundamentals data, price history, and news across multiple asset types (stocks, ETFs, forex).
Core Features
- Fundamentals Management: Store and retrieve company financial data
- Price History: TimescaleDB-optimized time-series storage
- News Aggregation: Store and search financial news articles
- Multi-Asset Support: Stocks, ETFs, forex pairs, macro indicators
- Data Validation: Automatic validation and cleaning
- Bulk Operations: Efficient batch updates
Database Schema Highlights
Fundamentals Table
fundamentals (
  id SERIAL PRIMARY KEY,
  symbol VARCHAR(20) NOT NULL,
  market_cap BIGINT,
  pe_ratio FLOAT,
  forward_pe FLOAT,
  peg_ratio FLOAT,
  price_to_book FLOAT,
  debt_to_equity FLOAT,
  roe FLOAT,
  dividend_yield FLOAT,
  eps FLOAT,
  revenue BIGINT,
  net_income BIGINT,
  sector VARCHAR(100),
  industry VARCHAR(100),
  last_updated TIMESTAMP,
  UNIQUE(symbol)
)
Price History (TimescaleDB Hypertable)
price_history (
  time TIMESTAMP NOT NULL,
  symbol VARCHAR(20) NOT NULL,
  open FLOAT,
  high FLOAT,
  low FLOAT,
  close FLOAT,
  volume BIGINT,
  adjusted_close FLOAT,
  PRIMARY KEY (time, symbol)
)
-- Hypertable partitioned by time
News Articles
news_articles (
  id SERIAL PRIMARY KEY,
  symbol VARCHAR(20),
  title TEXT,
  content TEXT,
  source VARCHAR(200),
  published_at TIMESTAMP,
  sentiment FLOAT,
  url TEXT,
  FOREIGN KEY (symbol) REFERENCES symbols(symbol)
)
API Endpoints
Get fundamentals data for a symbol
Source: backend/app/api/database.py:34-67
# Response
{
  "symbol": "AAPL",
  "market_cap": 2850000000000,
  "pe_ratio": 28.5,
  "forward_pe": 25.2,
  "peg_ratio": 2.1,
  "price_to_book": 42.3,
  "debt_to_equity": 1.73,
  "roe": 0.147,
  "dividend_yield": 0.0052,
  "eps": 6.15,
  "revenue": 383285000000,
  "net_income": 96995000000,
  "sector": "Technology",
  "industry": "Consumer Electronics",
  "last_updated": "2025-01-15T09:00:00Z"
}Update fundamentals data (single or bulk)
Source: backend/app/api/database.py:69-115
# Request (single)
{
  "symbol": "AAPL",
  "data": {
    "market_cap": 2850000000000,
    "pe_ratio": 28.5,
    ...
  }
}

# Request (bulk)
{
  "symbols": ["AAPL", "MSFT", "GOOGL"],
  "fetch_from_eodhd": true
}Get price history for a symbol
Source: backend/app/api/database.py:117-165
# Query Parameters
?start_date=2024-01-01&end_date=2024-12-31&interval=daily

# Response
{
  "symbol": "AAPL",
  "prices": [
    {
      "time": "2024-01-02T00:00:00Z",
      "open": 185.64,
      "high": 187.02,
      "low": 182.16,
      "close": 184.25,
      "volume": 82488500,
      "adjusted_close": 184.25
    }
  ]
}Get news articles for a symbol
Source: backend/app/api/database.py:167-205
# Query Parameters
?limit=20&offset=0&days=30
# Response
{
"symbol": "AAPL",
"total_count": 156,
"articles": [
{
"id": 12345,
"title": "Apple announces new product line",
"content": "...",
"source": "Reuters",
"published_at": "2025-01-15T08:00:00Z",
"sentiment": 0.75,
"url": "https://..."
}
]
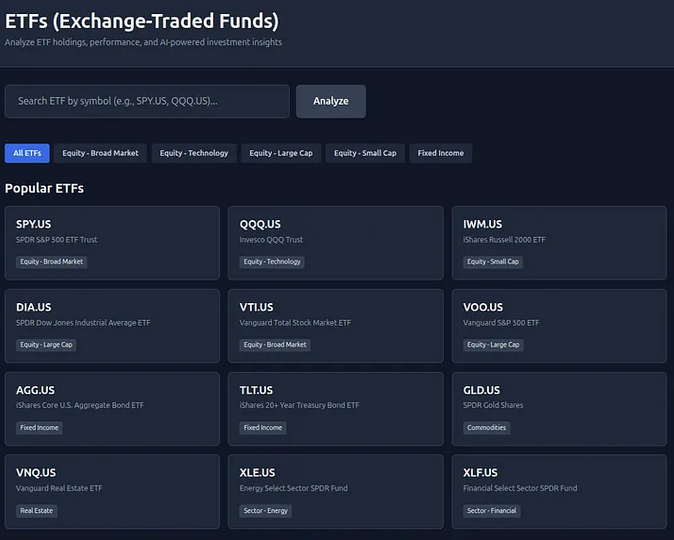
}EODHD Data API Integration
Overview
Chat with Fundamentals integrates with EODHD (End of Day Historical Data) API to provide comprehensive financial market data. The platform wraps 50+ EODHD endpoints across 9 categories.
API Categories
1. Market Data (7 endpoints)
- Real-time quotes
- Historical EOD prices
- Intraday data
- Live prices
- Technical indicators
2. Fundamentals (12 endpoints)
- Company fundamentals
- Financial statements (income, balance sheet, cash flow)
- Earnings history
- Analyst recommendations
- Insider transactions
3. Calendar Data (5 endpoints)
- Earnings calendar
- IPO calendar
- Splits calendar
- Dividends calendar
4. News (3 endpoints)
- Financial news by symbol
- General market news
- Sentiment analysis
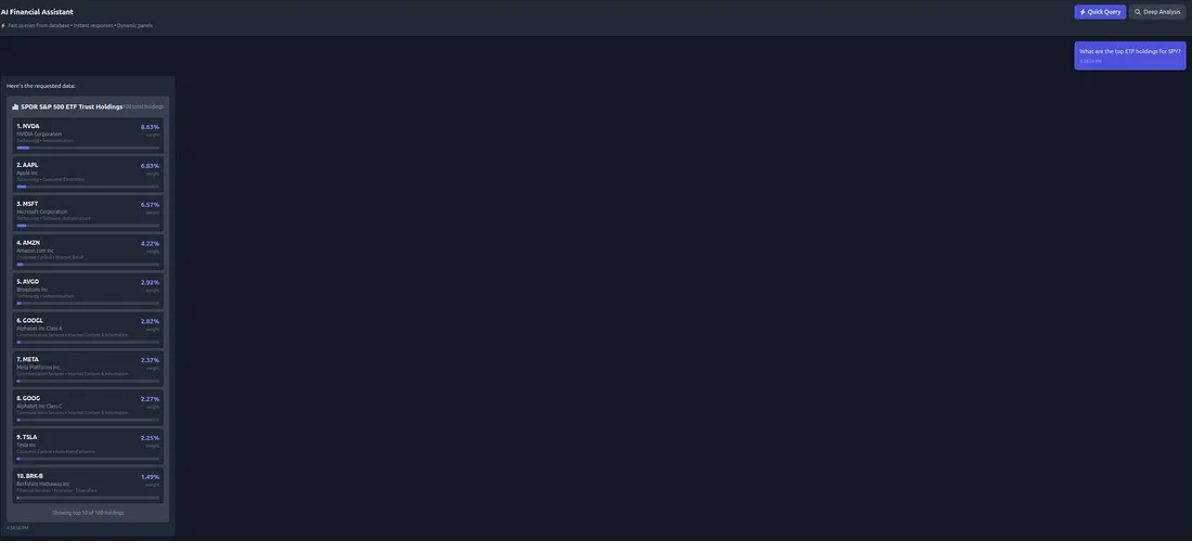
5. ETF Data (6 endpoints)
- ETF fundamentals
- Holdings data
- Sector allocations
- Performance metrics
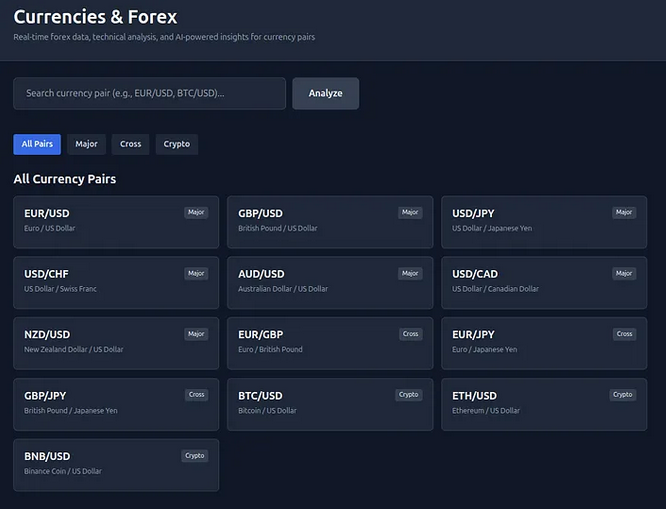
6. Forex & Crypto (4 endpoints)
- Currency exchange rates
- Cryptocurrency prices
- Historical forex data
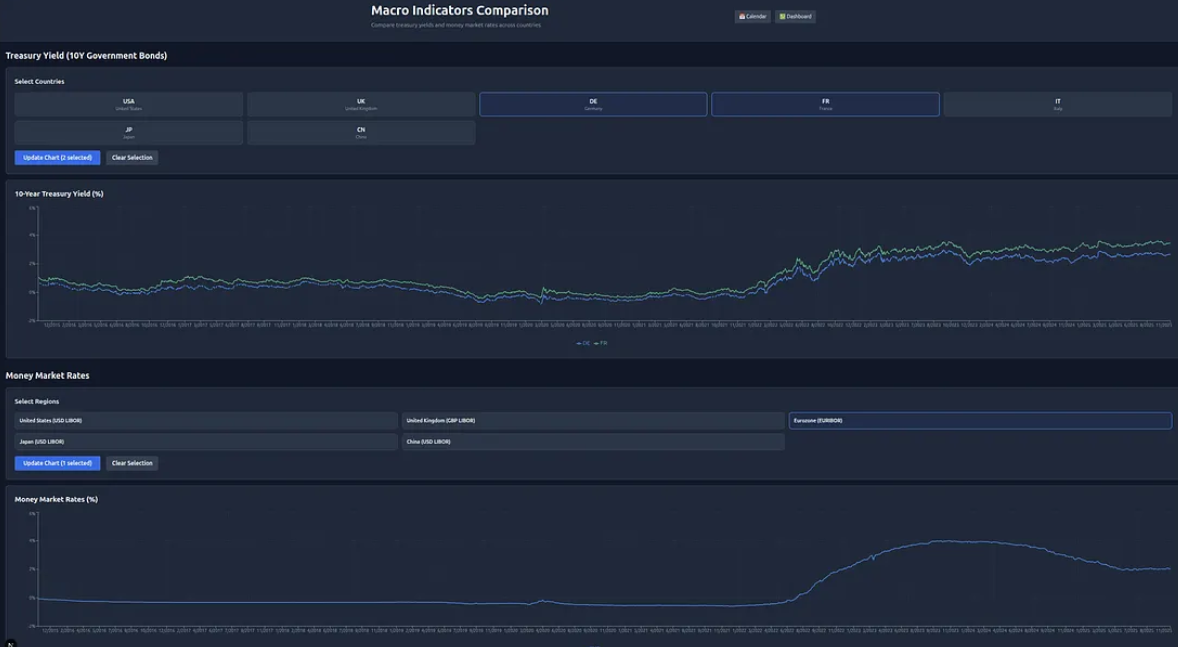
7. Macro Indicators (8 endpoints)
- GDP data
- Inflation rates
- Interest rates
- Employment data
- Consumer confidence
8. Options (3 endpoints)
- Options chain data
- Historical options prices
- Implied volatility
9. Screener & Search (2 endpoints)
- Stock screener
- Symbol search
API Wrapper Implementation
All EODHD endpoints are wrapped in a unified FastAPI interface with:
- Caching: Redis caching to reduce API calls
- Rate Limiting: Automatic rate limit handling
- Error Handling: Graceful degradation on API errors
- Data Validation: Pydantic models for all responses
- Batch Operations: Efficient multi-symbol requests
Example API Endpoints
Get real-time quote for a symbol
Source: backend/app/api/eodhd.py:45-78
# Response
{
  "code": "AAPL.US",
  "timestamp": 1705324800,
  "close": 185.64,
  "high": 187.02,
  "low": 182.16,
  "open": 182.15,
  "volume": 82488500,
  "previousClose": 181.18,
  "change": 4.46,
  "change_p": 2.46
}Get company fundamentals
Source: backend/app/api/eodhd.py:80-145
# Response (partial - very large object)
{
  "General": {
    "Code": "AAPL",
    "Name": "Apple Inc",
    "Exchange": "US",
    "Sector": "Technology",
    "Industry": "Consumer Electronics",
    "MarketCapitalization": 2850000000000
  },
  "Highlights": {
    "MarketCapitalization": 2850000000000,
    "EBITDA": 130541000000,
    "PERatio": 28.51,
    "PEGRatio": 2.14,
    ...
  },
  "Valuation": {...},
  "Financials": {
    "Balance_Sheet": {...},
    "Income_Statement": {...},
    "Cash_Flow": {...}
  }
}Get upcoming earnings calendar
Source: backend/app/api/eodhd.py:235-278
# Query Parameters
?from=2025-01-15&to=2025-01-22

# Response
{
  "earnings": [
    {
      "code": "AAPL.US",
      "report_date": "2025-01-18",
      "date": "2025-01-18",
      "before_after_market": "AfterMarket",
      "currency": "USD",
      "estimate": "2.10",
      "actual": null
    }
  ]
}
API Reference Overview
Base URL
http://localhost:8000/apiAuthentication
All API endpoints require authentication via JWT token in the Authorization header:
Authorization: Bearer <jwt_token>Rate Limiting
API endpoints are rate-limited to prevent abuse:
- Authenticated users: 100 requests per minute
- Unauthenticated: 10 requests per minute
Response Format
All responses follow a consistent JSON structure:
{
  "data": {...},           // Response data
  "error": null,           // Error message (if any)
  "timestamp": "...",      // ISO 8601 timestamp
  "execution_time": 0.123  // Execution time in seconds
}
Error Handling
Errors return appropriate HTTP status codes with detailed messages:
{
  "data": null,
  "error": {
    "code": "VALIDATION_ERROR",
    "message": "Invalid symbol format",
    "details": {...}
  },
  "timestamp": "2025-01-15T10:30:00Z"
}
Common HTTP Status Codes
| Code | Meaning |
|---|---|
| 200 | OK - Request successful |
| 201 | Created - Resource created successfully |
| 400 | Bad Request - Invalid input |
| 401 | Unauthorized - Authentication required |
| 403 | Forbidden - Insufficient permissions |
| 404 | Not Found - Resource not found |
| 429 | Too Many Requests - Rate limit exceeded |
| 500 | Internal Server Error - Server error |
Portfolio API
Get current portfolio with live prices
Source: backend/app/api/portfolio.py:45-78
Add or update position
Source: backend/app/api/portfolio.py:80-123
Delete a position
Source: backend/app/api/portfolio.py:191-212
Run portfolio optimization
Source: backend/app/api/portfolio.py:125-189
Get portfolio performance metrics
Source: backend/app/api/portfolio.py:214-267
Get historical portfolio snapshots
Source: backend/app/api/portfolio.py:269-312
AI Analysis API
Run AI analysis
Source: backend/app/api/marketsense.py:34-112
Get historical analyses for a symbol
Source: backend/app/api/marketsense.py:114-156
WebSocket endpoint for agent console
Source: backend/app/api/websocket.py:23-67
RAG API
Query quant research library
Source: backend/app/api/rag.py:45-98
Query SEC filings
Source: backend/app/api/rag.py:100-156
List available research papers
Source: backend/app/api/rag.py:158-189
Index a new research paper
Source: backend/app/api/rag.py:191-234
Database API
Get fundamentals data
Source: backend/app/api/database.py:34-67
Update fundamentals (single or bulk)
Source: backend/app/api/database.py:69-115
Get price history
Source: backend/app/api/database.py:117-165
Update price history
Source: backend/app/api/database.py:207-256
Get news articles
Source: backend/app/api/database.py:167-205
Update news articles
Source: backend/app/api/database.py:258-301
EODHD API
All EODHD endpoints are wrapped under /api/eodhd/* with caching and rate limiting.
Market Data Endpoints
Real-time quote
Source: backend/app/api/eodhd.py:45-78
Historical end-of-day prices
Source: backend/app/api/eodhd.py:80-125
Intraday prices (1min/5min/1h intervals)
Source: backend/app/api/eodhd.py:127-178
Fundamentals Endpoints
Company fundamentals
Source: backend/app/api/eodhd.py:180-245
Financial statements
Source: backend/app/api/eodhd.py:247-298
Calendar Endpoints
Earnings calendar
Source: backend/app/api/eodhd.py:235-278
IPO calendar
Source: backend/app/api/eodhd.py:280-315
Stock splits calendar
Source: backend/app/api/eodhd.py:317-352
News Endpoints
News articles for symbol
Source: backend/app/api/eodhd.py:354-389
See full EODHD API documentation for all 50+ available endpoints.
CrewAI Agent Framework
Overview
Chat with Fundamentals uses CrewAI for multi-agent orchestration in the AI Analysis system. CrewAI provides role-based agent collaboration with task delegation and tool sharing.
Agent Configuration
Agent Structure
from crewai import Agent, Task, Crew

# Define agent
agent = Agent(
    role="Fundamentals Analyst",
    goal="Analyze company financial statements",
    backstory="Expert financial analyst with 15 years experience...",
    tools=[fundamentals_tool, financial_statements_tool],
    llm=ChatOpenAI(model="gpt-4"),
    verbose=True
)
Task Definition
task = Task(
    description="Analyze AAPL financial statements and rate 1-10",
    agent=fundamentals_agent,
    expected_output="Numerical score with brief reasoning"
)
Crew Orchestration
crew = Crew(
    agents=[fundamentals_agent, news_agent, price_agent, macro_agent],
    tasks=[fund_task, news_task, price_task, macro_task],
    process=Process.parallel  # Run agents in parallel
)

result = crew.kickoff()
Custom Tools
Agents have access to custom tools for data retrieval:
Fundamentals Tool
@tool("Get Fundamentals")
def get_fundamentals(symbol: str) -> dict:
    """Get company fundamentals from database"""
    return fetch_fundamentals_from_db(symbol)
News Tool
@tool("Get News")
def get_news(symbol: str, days: int = 30) -> list:
    """Get recent news articles for symbol"""
    return fetch_news_from_db(symbol, days)
Price Tool
@tool("Get Price History")
def get_price_history(symbol: str, days: int = 365) -> list:
    """Get historical price data"""
    return fetch_prices_from_db(symbol, days)
WebSocket Logging
All agent activities are logged via WebSocket for real-time monitoring:
class WebSocketLogger:
    async def log_agent_status(self, agent_name, status, message):
        await self.ws.send_json({
            "event": "agent_status",
            "agent": agent_name,
            "status": status,
            "message": message,
            "timestamp": datetime.now().isoformat()
        })

    async def log_task_complete(self, agent_name, output):
        await self.ws.send_json({
            "event": "task_complete",
            "agent": agent_name,
            "output": output
})Database Schema
Entity Relationship Overview
The database schema is designed around five core entities: Users, Portfolios, Symbols, Fundamentals, and Prices.
Core Tables
Users
users (
  id SERIAL PRIMARY KEY,
  email VARCHAR(255) UNIQUE NOT NULL,
  hashed_password VARCHAR(255) NOT NULL,
  created_at TIMESTAMP DEFAULT NOW(),
  last_login TIMESTAMP,
  is_active BOOLEAN DEFAULT TRUE
)
Portfolios
portfolios (
  id SERIAL PRIMARY KEY,
  user_id INTEGER REFERENCES users(id) ON DELETE CASCADE,
  name VARCHAR(200) NOT NULL,
  description TEXT,
  created_at TIMESTAMP DEFAULT NOW(),
  updated_at TIMESTAMP DEFAULT NOW(),
  UNIQUE(user_id, name)
)
Positions
positions (
  id SERIAL PRIMARY KEY,
  portfolio_id INTEGER REFERENCES portfolios(id) ON DELETE CASCADE,
  symbol VARCHAR(20) NOT NULL,
  shares FLOAT NOT NULL,
  avg_cost FLOAT NOT NULL,
  transaction_date DATE NOT NULL,
  created_at TIMESTAMP DEFAULT NOW(),
  updated_at TIMESTAMP DEFAULT NOW()
)
Symbols
symbols (
  symbol VARCHAR(20) PRIMARY KEY,
  name VARCHAR(200),
  exchange VARCHAR(50),
  asset_type VARCHAR(50),  -- stock | etf | forex | crypto
  sector VARCHAR(100),
  industry VARCHAR(100),
  country VARCHAR(50),
  currency VARCHAR(10),
  is_active BOOLEAN DEFAULT TRUE,
  created_at TIMESTAMP DEFAULT NOW()
)
Fundamentals
fundamentals (
  id SERIAL PRIMARY KEY,
  symbol VARCHAR(20) REFERENCES symbols(symbol),
  market_cap BIGINT,
  pe_ratio FLOAT,
  forward_pe FLOAT,
  peg_ratio FLOAT,
  price_to_book FLOAT,
  price_to_sales FLOAT,
  debt_to_equity FLOAT,
  current_ratio FLOAT,
  quick_ratio FLOAT,
  roe FLOAT,
  roa FLOAT,
  profit_margin FLOAT,
  operating_margin FLOAT,
  dividend_yield FLOAT,
  eps FLOAT,
  revenue BIGINT,
  net_income BIGINT,
  ebitda BIGINT,
  free_cash_flow BIGINT,
  last_updated TIMESTAMP DEFAULT NOW(),
  UNIQUE(symbol)
)
Price History (TimescaleDB Hypertable)
price_history (
  time TIMESTAMP NOT NULL,
  symbol VARCHAR(20) NOT NULL,
  open FLOAT,
  high FLOAT,
  low FLOAT,
  close FLOAT,
  volume BIGINT,
  adjusted_close FLOAT,
  PRIMARY KEY (time, symbol)
);

-- Convert to hypertable for time-series optimization
SELECT create_hypertable('price_history', 'time');
News Articles
news_articles (
  id SERIAL PRIMARY KEY,
  symbol VARCHAR(20) REFERENCES symbols(symbol),
  title TEXT NOT NULL,
  content TEXT,
  source VARCHAR(200),
  author VARCHAR(200),
  published_at TIMESTAMP NOT NULL,
  sentiment FLOAT,  -- -1.0 to 1.0
  url TEXT,
  created_at TIMESTAMP DEFAULT NOW(),
  INDEX idx_news_symbol_date (symbol, published_at)
)
AI Analyses
ai_analyses (
  id SERIAL PRIMARY KEY,
  symbol VARCHAR(20) NOT NULL,
  analysis_type VARCHAR(50),  -- stock | etf | forex | macro
  signal VARCHAR(10),  -- BUY | HOLD | SELL
  conviction INTEGER,  -- 1-10
  fundamentals_score INTEGER,
  news_score INTEGER,
  price_score INTEGER,
  macro_score INTEGER,
  reasoning TEXT,
  risk_factors TEXT[],
  llm_provider VARCHAR(50),
  execution_time_seconds FLOAT,
  created_at TIMESTAMP DEFAULT NOW(),
  INDEX idx_analyses_symbol_date (symbol, created_at)
)
Indexes
Key indexes for performance optimization:
-- Symbol lookups
CREATE INDEX idx_symbols_asset_type ON symbols(asset_type);
CREATE INDEX idx_symbols_sector ON symbols(sector);

-- Price queries
CREATE INDEX idx_prices_symbol_time ON price_history(symbol, time DESC);

-- News queries
CREATE INDEX idx_news_symbol_date ON news_articles(symbol, published_at DESC);
CREATE INDEX idx_news_sentiment ON news_articles(sentiment) WHERE sentiment IS NOT NULL;

-- Portfolio queries
CREATE INDEX idx_positions_portfolio ON positions(portfolio_id);
CREATE INDEX idx_positions_symbol ON positions(symbol);
TimescaleDB Continuous Aggregates
Pre-computed aggregates for common queries:
-- Daily OHLCV from intraday data
CREATE MATERIALIZED VIEW daily_prices
WITH (timescaledb.continuous) AS
SELECT
  time_bucket('1 day', time) AS day,
  symbol,
  first(open, time) AS open,
  max(high) AS high,
  min(low) AS low,
  last(close, time) AS close,
  sum(volume) AS volume
FROM price_history
GROUP BY day, symbol;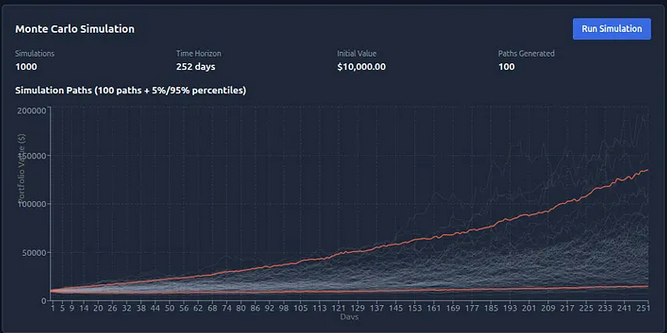
Portfolio Optimization Strategies
Implementation Details
1. Mean-Variance Optimization (Markowitz)
Implementation using PyPortfolioOpt:
from pypfopt import EfficientFrontier, risk_models, expected_returns

# Calculate expected returns and covariance
mu = expected_returns.mean_historical_return(prices)
S = risk_models.sample_cov(prices)

# Optimize for maximum Sharpe ratio
ef = EfficientFrontier(mu, S)
weights = ef.max_sharpe(risk_free_rate=0.045)
cleaned_weights = ef.clean_weights()

# Get performance metrics
performance = ef.portfolio_performance(risk_free_rate=0.045)
# Returns: (expected_return, volatility, sharpe_ratio)
2. Minimum Variance
ef = EfficientFrontier(mu, S)
weights = ef.min_volatility()
cleaned_weights = ef.clean_weights()

performance = ef.portfolio_performance(risk_free_rate=0.045)
3. Black-Litterman
from pypfopt.black_litterman import BlackLittermanModel

# Market equilibrium
market_caps = get_market_caps(symbols)
market_prices = get_prices(symbols)

# Investor views (optional)
viewdict = {
    "AAPL": 0.20,  # Expect 20% return
    "GOOGL": 0.15
}

# Black-Litterman model
bl = BlackLittermanModel(
    S,
    pi="market",
    market_caps=market_caps,
    risk_aversion=2.5,
    absolute_views=viewdict
)

# Get posterior returns
bl_returns = bl.bl_returns()

# Optimize
ef = EfficientFrontier(bl_returns, S)
weights = ef.max_sharpe(risk_free_rate=0.045)
Constraints
Common constraints applied to all optimizations:
# Weight bounds
ef.add_constraint(lambda w: w >= 0)  # No shorting
ef.add_constraint(lambda w: w <= 0.30)  # Max 30% per position

# Sector constraints
sector_mapper = get_sector_mapper(symbols)
sector_lower = {sector: 0.05 for sector in sectors}
sector_upper = {sector: 0.40 for sector in sectors}
ef.add_sector_constraints(sector_mapper, sector_lower, sector_upper)
Performance Attribution
Analyze portfolio performance by position:
def calculate_attribution(portfolio_weights, returns, benchmark_returns):
    """Calculate performance attribution vs benchmark"""

    # Active weights
    active_weights = portfolio_weights - benchmark_weights

    # Allocation effect
    allocation = active_weights * (benchmark_sector_returns - benchmark_return)

    # Selection effect
    selection = benchmark_weights * (returns - benchmark_sector_returns)

    # Interaction effect
    interaction = active_weights * (returns - benchmark_sector_returns)

    return {
        'allocation': allocation.sum(),
        'selection': selection.sum(),
        'interaction': interaction.sum()
    }
Risk Analytics
Value at Risk (VaR)
Calculate portfolio VaR using historical simulation:
def calculate_var(returns, confidence_level=0.95):
    """Calculate Value at Risk"""
    return np.percentile(returns, (1 - confidence_level) * 100)
Conditional Value at Risk (CVaR)
Expected loss beyond VaR threshold:
def calculate_cvar(returns, confidence_level=0.95):
    """Calculate Conditional Value at Risk"""
    var = calculate_var(returns, confidence_level)
    return returns[returns <= var].mean()
Monte Carlo Simulation
Simulate future portfolio paths:
def monte_carlo_simulation(
current_value,
expected_return,
volatility,
years,
simulations=10000
):
"""Run Monte Carlo simulation of portfolio returns"""
days = years * 252
dt = 1/252
# Geometric Brownian Motion
results = np.zeros((simulations, days))
for i in range(simulations):
prices = [current_value]
for j in range(days):
drift = (expected_return - 0.5 * volatility**2) * dt
shock = volatility * np.random.normal() * np.sqrt(dt)
price = prices[-1] * np.exp(drift + shock)
prices.append(price)
results[i] = prices[1:]
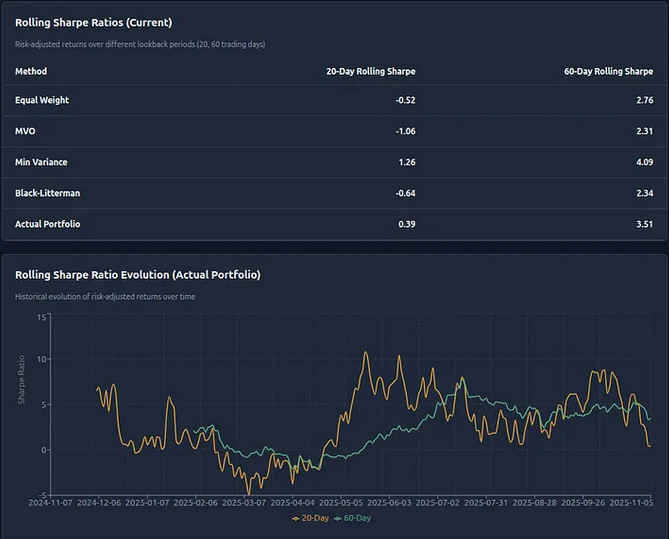
return resultsRolling Sharpe Ratio
def calculate_rolling_sharpe(returns, window=252, risk_free_rate=0.045):
    """Calculate rolling Sharpe ratio"""

    excess_returns = returns - risk_free_rate/252
    rolling_mean = excess_returns.rolling(window).mean()
    rolling_std = excess_returns.rolling(window).std()

    return (rolling_mean / rolling_std) * np.sqrt(252)
Correlation Analysis
def calculate_correlation_matrix(returns):
    """Calculate correlation matrix of returns"""
    return returns.corr()

def find_diversification_opportunities(corr_matrix, threshold=0.3):
    """Find low-correlation pairs for diversification"""

    pairs = []
    for i in range(len(corr_matrix.columns)):
        for j in range(i+1, len(corr_matrix.columns)):
            corr = corr_matrix.iloc[i, j]
            if abs(corr) < threshold:
                pairs.append({
                    'asset1': corr_matrix.columns[i],
                    'asset2': corr_matrix.columns[j],
                    'correlation': corr
                })

    return sorted(pairs, key=lambda x: abs(x['correlation']))